Membership by the Numbers
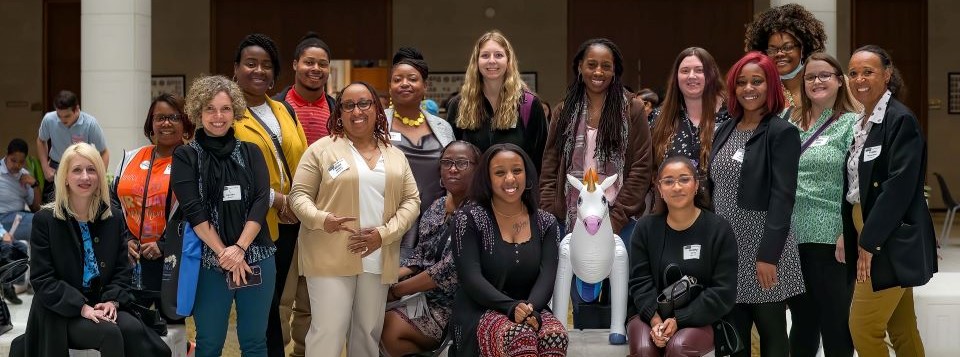
Group of NASW members pose during Advocacy Day 2023

NASW invites members to complete member profiles by providing information about their personal and professional identities. Responses to demographic questions are always optional, but members’ completed profiles are very helpful for NASW to understand members’ practice needs and the ways members identify themselves. Personal demographics also help NASW ensure that the volunteer social work leadership of the association is representative of the members we serve. 

Practice and demographic options were developed with input from members and from NASW’s national committees of volunteer social worker leaders. Members who have suggested changes may send to Membership@socialworkers.org with Demographics in the subject line. This data represents NASW active membership as of August 2023. Not all members have completed their profiles. Members can identify up to three practice selections, so the reported practice percentages are greater than the total membership.


Ethnicity Total Percentage
Another Race or Ethnicity 1,642 1.51%
Asian 1,976 1.81%
Black/African American 9,443 8.67%
Chicano/Mexican 1,921 1.76%
Native American or Alaska Native 629 0.58%
Native Hawaiian or Other Pacific Islander  200 0.18%
Other Hispanic/Latino 3,137 2.88%
Puerto Rican 1,076 0.99%
White 59,605 54.74%
No Ethnicity Selected 29,264 26.87%
Generation Total Percentage
Generation Z (Born 1996 or Later) 7,734 7.10%
Millennial (Born 1980 to 1995) 31,302 28.75%
Generation X (Born 1965 to 1979) 30,229 27.76%
Baby Boomers (Born 1946 to 1964) 30,750 28.24%
Born 1945 or Earlier 4,983 4.58%
No Birthdate Selected 3,895 3.58%
Gender Total Percentage
Man 11,715 10.76%
Non-Binary/Genderqueer                        678 0.62%
Other 48 0.04%
Transgender Man 115 0.11%
Transgender Woman 54 0.05%
Woman 67,914 62.37%
No Gender Selected 28,369 26.05%
Practice Areas Total Percentage
Addictions/Substance Use 5,164 4.74%
Adolescent Services 4,147 3.81%
Aging 4,553 4.18%
Case Management 1,542 1.42%
Child Welfare 7,767 7.13%
Chronic Diseases 257 0.24%
Community Organizing 914 0.84%
Criminal Justice 1,124 1.03%
Disabilities 1,248 1.15%
Immigrant and Displaced Persons Services 593 0.54%
Employee Assistance Programs 549 0.50%
Equity and Human Rights 285 0.26%
Grief/Bereavement 1,260 1.16%
Health Care 8,074 7.41%
Housing and Homeless Services 415 0.38%
International 309 0.28%
Juvenile Justice 126 0.12%
Mental Health 41,516 38.13%
Military and Veterans 864 0.79%
Other 5,847 5.37%
Palliative Care 550 0.51%
Philanthropy 121 >0.11%
Advocacy and Public Policy 980 0.90%
Psychotherapy Services 6,735 6.18%
Public Health 776 0.71%
School Social Work 6,320 5.80%
Social Work Education 1,083 0.99%
Trauma and Violence 4,278 3.93%
No Practice Area Selected 34,281 31.48%


Membership Types & Annual Dues


Regular Membership

MSW/DSW/PhD: $236/year
BSW: $158/year

Student Membership

BSW/MSW Student: $60/year
Associate Student: $60/year
Doctoral Student: $179/year

See all membership types & dues.